Booyah, Streetfight and more LBS News: Booyah
After 4.5 million downloads of MyTown, Booyah is back with MyTown 2, a new take on gaming that incorporates more of a CityVille approach while still using the real world as a game board.
It's more along the lines of Monopoly, with property prices based on demand of other... Continue reading
lunes, 31 de octubre de 2011
Mapping the 7 Billion People on the Planet - All Points Blog
Mapping the 7 Billion People on the Planet
The seven billionth person to join us on the planet is expected to be born around this date. And that means a chance to look at the population of our little blue planet via maps. Here's a samplng of offerings on the Web.
The four-tabbed app explores how we got to this number then via maps explores the distribution, growth rate and the life expectency of the 7 billion inhabitants.
via @allencarroll
The BBC also offers a four tiered approach to coverage, but without maps. Of interest is an interactive app where visitors can key in their birth date and location what number they are in the 7 billion along with details of their peers. The article also covers population control, asks how many more are coming and shares seven individual stories of the world's growing family.
via @mapserving
World Population Growth and Projections
News.com.au offers a time slider to examine past and future expected population numbers.
To coincide with the arrival of the world's 7 billionth person on Oct. 31, 2011, National Geographic magazine has collected all of its related population coverage across 2011 in an app for iPad, that is now available on the App Store through December 31. (press release, the app is free and sponsored by DuPont)
United Nation's 7billionactions.org
"7 Billion Actions, established by the United Nations Population Fund, inspires change that will make a difference by highlighting positive action by individuals and organizations around the world." The dashboard with various media to help make sense of this milestone and includes the opportunity to tell you own story. Here's one from a fellow geographer. The data tab provides access to maps and graphics. Sponsored by SAP.
Population Resource Board Resources
Among the videos and data offered, the PRB offers a maps over time covering six key topics including HIV. (press release)
Population Action International offers a count up ticker to 7 billion and a chance to count yourself and put yourself on the map. The information you create can then be shared via social media. (press release)
Felix Pharand's Visualizations Mapping the Presence of Technology on the Globe
CNN has a nice slide show of Canadian anthropologist Felix Pharand's visualizations mapping the presence of technology onto a selection of satellite images showing the Earth from space. (We covered this on our Worth a Click section two weeks ago. Also in that section and relevant: How big data will help manage a world of 7 billion people - GigaOM)
by Adena Schutzberg on 10/31 at 03:00 AM | 0 Comments and 0 Reactions | 
Latest from Directions Magazine
International Geocoding: The Key to Multi-national Success
How to be an Elite Marathoner and Work in GIS
Visualizing the Socio-economic Profile of the Bay of Plenty Region - New Zealand
Podcast: Making a Case for Federal Funding of Geography Education
GEOINT: Predictions for Growth, with an Asterisk


All Points Blog Newsletter
Follow
Recent Comments
Esri Releases New Version of CityEngine
Esri Releases New Version of CityEngine

Esri Releases New Version of CityEngine
Esri CityEngine 2011 Makes It Easier to Create 3D Models from 2D GIS Data
October 27, 2011

CityEngine enables the quick creation of 3D cities out of 2D data.
Redlands, California—Esri CityEngine 2011, the latest version of Esri's software for creating high-quality 3D content, is now available. New key features of CityEngine 2011 include support for georeferenced data and an improved user interface.
CityEngine is the software of choice for 3D city modeling in urban planning, architecture, defense, simulation, game development, and film production. CityEngine enables the quick creation of 3D cities out of 2D data and allows the efficient design and modeling of virtual urban environments in 3D.
This latest release of CityEngine makes it easier to use geographic information system (GIS) data to create geographically accurate models for urban design, historical reenactment models, or realistic models of actual cities. It now includes support for georeferenced data such as Esri's File Geodatabase (GDB) and KML. The user interface has been greatly improved for ease of use with drag-and-drop data importing features.
"We are very happy to release this version of CityEngine as a new member of the Esri product family," says Pascal Mueller, director of the new Esri R&D Center Zurich, formerly Procedural Inc. "This CityEngine version comes with many new, exciting features such as the intuitive drag and drop of files into your 3D scene. And with the introduction of georeferencing in CityEngine, we made the first step toward accurate and easy-to-use master planning and urban design."
Other key features of CityEngine 2011 include
- Introduction of styles for rule-based modeling of buildings
- Intuitive street editing tools
- Automatic skeleton subdivision of blocks into lots
- 3D Viewport enhancements such as reflections and ambient occlusion
- Advanced material management and export
With the CityEngine 2011 release, Esri introduces Basic and Advanced licensing options. All current CityEngine customers under subscription will be automatically migrated to one of these licenses.
CityEngine is available for the Windows, Mac, and Linux platforms.
For more information or a free trial, visit esri.com/cityengine.
# # #
Press Information:
Matthew DeMeritt, Esri
Tel.: 909-793-2853, extension 1-2930
E-mail (press only): press@esri.com
General Information: info@esri.com
Free Graphics for Your Halloween Maps
Free Graphics for Your Halloween Maps
Free Graphics for Your Halloween Maps

Mostly Ghostly typeface by Chad Savage

Horror Icon Set, by David Arazim, via Smashing Magazine

Halloween Icon Set, by css creme

ArcGIS Scary Symbols, by Esri. Esri symbols, for the most part, are very friendly. I had a hard time coming up with even these few Halloween-oriented point symbols. (I searched for “devil” and only came up with a dust devil symbol, for example!) From left to right we’ve got: vandalism fire, tree 4, ghost town, and skull and crossbones.
Freeance View
Freeance View
Alguien echo de menos en la Conferencia Europea de ESRI, en Madrid España, que hablando de ArcGIS for Android, alguien dijera algo de ArcGIS for BlackBerry????
Aquí os dejo algo de información:Put Your ArcGIS Server Maps on BlackBerry for Free
Now there's no reason to not have your GIS on your BlackBerry smartphone.
Freeance View is a software package that allows organizations running ESRI's ArcGIS Server to publish their maps, live, to an unlimited number of BlackBerry smartphones. It's fast, free, easy and secure.
Push your GIS maps to BlackBerrys for public use, field workers, executives - anyone. Whether you're a government agency, private organization, for-profit or non-profit, in any industry - Freeance View is your no-cost solution for GIS on BlackBerry smartphones.
.....
Cómo presentar el resultado de tu trabajo
Cómo presentar el resultado de tu trabajo:
En el capítulo “¿Qué debe saber un CM sobre la marca?” mencioné la importancia de trazar la estrategia de comunicación y los objetivos junto al cliente para tener una base sólida con la cual generar un historial que, inicialmente, nos servirá para comparar y medir el resultado de nuestro trabajo. Hoy veremos qué otras cosas debes tener en cuenta a la hora de presentar un reporte al cliente.
Una pregunta que me suelen hacer es “¿En qué formato presentas lo reportes?“. La verdad es que depende lo que el cliente necesite, puedo armarlos en PDF, un documento de texto (Word, Docs de Google, etc.) o diapositivas. No utilizo ningún formato extraño, ni programa que los genere automáticamente.
¿Qué se mide?
- Datos cuantitativos. Es decir, el crecimiento de seguidores o fans en el último mes, la cantidad de menciones y comentarios, el número de likes, Re-tweets, etc.
- Datos cualitativos. Por ejemplo, destacar comentarios relevantes (positivos o negativos, en este último caso su tratamiento y evolución).
- Datos acerca de la actividad. Qué contenido gustó más a su público, vista de mensajes, horas pico de interacción, tráfico dirigido al sitio, etc.
- Alcance del objetivo. Sin importar cuál sea, se debe analizar los resultados en base al objetivo planeado y mostrar el grado de alcance logrado.
Les comparto una infografía que me ha gustado mucho:

¿Qué debes evitar en un reporte?
- No utilices las mismas métricas para todas las redes sociales. Cada red social presenta funciones diferentes, por ello debes plantear objetivos y métricas distintas. Por ejemplo, en Twitter es muy fácil seguir el número de comentarios donde hacen mención de tu marca o hablan de tu producto; mientras que en Facebook, esa métrica es más difícil de lograr (recientemente incorporó la herramienta “personas que están hablando de esto” y aún no es muy específica).
- Mide más allá de los fans y el “me gusta”. Facebook presenta varios análisis de tu fan page que le permitirán saber al cliente desde dónde vienen los usuarios, cómo encontraron nuestra página, cuánto tráfico le deriva la red social a su sitio, etc.
- No esperes a entregar un reporte para informar al cliente sobre lo importante, sea malo o bueno. Intenta, semana a semana, mantenerlo al tanto.
¿Qué debes hacer para lograr un buen reporte?
- Utiliza el tono y vocabulario del cliente. Debes dejar de lado tu entendimiento y cultura 2.0. Hablar con propiedad es ser claros ante quienes reportamos.
- Haz uso todas las herramientas análiticas que presenté en capítulos pasado y que puedas encontrar en la Web para poder identificar cuáles son las que mejor aplican a los objetivos de tu marca.
- Cita las fuentes de consulta analítica.
- Se sincero.
- Genera valor agregado. Es bueno aportar un análisis o conclusión final de todas las métricas presentadas, no solo dar números y datos.
- Compara el crecimiento de tu marca en el tiempo.
- Identifica los puntos débiles de la marca y propone trabajar en ellos para el siguiente mes. Plantea nuevos objetivos constantemente.
- Por último, hazte la siguiente pregunta: ¿Se están cumpliendo los objetivos de tu cliente? En caso de que no esté sucediendo, analiza si son objetivos reales e intenta identificar los motivos para mejorarlos.
Recuerda, como dije al comienzo de este capítulo, el reporte que envíes al cliente representará el trabajo que has hecho durante todo un periódo, intenta reflejar lo relevante y haz que la presentación hable por tí, sin exagerar y sin mentir.
 Débora Lambrechts para Maestros del Web.
Agrega tu comentario | Enlace permanente al artículo


jueves, 27 de octubre de 2011
Joblers, una bolsa de empleo en un widget
Joblers, una bolsa de empleo en un widget:
 Ya casi nos habíamos olvidado de los widgets y lo cierto es que siguen teniendo una gran utilidad en muchos casos, quizás lo bueno es que nos hemos olvidado de la palabra y cada día los usamos con total naturalidad como los que tenemos en nuestros blogs para integrarlos con las redes sociales. En el sector de empleo por internet aún hay mucho que innovar y aunque la situación económica actual no es buena, lo cierto es que hay muchas empresas que están creciendo a ritmos muy altos, sobre todo las relacionadas con la tecnología.
En este contexto surge un nuevo proyecto en internet que puede ser de utilidad para las empresas que busquen trabajadores y quieran publicar las ofertas en su propia web. Se trata de Joblers, una iniciativa de una empresa valenciana fundada por Albert Soriano y Rafel Soriano que buscan facilitar el reclutamiento y la gestión de recursos humanos a las empresas. En la web de la empresa summonpress podemos ver un caso real de uso de Joblers donde se integra un botón lateral y un widget con las ofertas de empleo disponibles.
Algunas de las funcionalidades de Joblers que pueden resultar de utilidad para la empresa son:
Posibilidad de difusión masiva y de manera internacional de las ofertas a través de buscadores de anuncios. El candidato no necesita registrarse. El sistema de envío de currículo se realiza en pocos minutos y de manera sencilla, con posibilidad de ampliar la información del candidato. Recepción de la solicitud de manera ordenada y organizada. Servicio de revisión y categorización en el panel de gestión para empresas. Actualización de las ofertas de empleo y la disponibilidad de los candidatos. Búsqueda y seguimiento del talento, con la posibilidad de marcar a los candidatos como favoritos.
Metro de Madrid completará la gestión remota de todas sus estaciones a finales de 2011
Metro de Madrid completará la gestión remota de todas sus estaciones a finales de 2011: A finales del año el curso, Metro de Madrid gestionará de forma remota la totalidad de las estaciones monitorizables de la red de transporte desde el Centro de Operaciones de Mantenimiento y Monitorización de Instalaciones y Telecomunicaciones (COMMIT).
En 2015, las compañías generarán la mitad de sus ventas web a través de redes sociales y aplicaciones móviles
En 2015, las compañías generarán la mitad de sus ventas web a través de redes sociales y aplicaciones móviles: El comercio electrónico experimentará una importante evolución según Gartner.
Esri premia al Ayuntamiento de Madrid y a la Generalitat de Catalunya por su apuesta GIS
Esri premia al Ayuntamiento de Madrid y a la Generalitat de Catalunya por su apuesta GIS: Los proyectos SIGMA y SICTRA se presentan en la Conferencia Europea Esri que tiene como sede la capital española y a la que asisten más de 2.500 profesionales del sector.
RIM retrasa el lanzamiento de PlayBook OS 2.0
RIM retrasa el lanzamiento de PlayBook OS 2.0: RIM retrasa a febrero la actualización del sistema operativo de su tablet, el BlackBerry PlayBook. Se esperaba que la canadiense presentara este mes la versión definitiva del sistema operativo PlayBook OS 2.0, pero finalmente no ha sido así
Betabeers, reunión de desarrolladores web y móvil
Betabeers, reunión de desarrolladores web y móvil:
![]()
A falta de Pizza buenas son las cervezas y Betabeers poco a poco se va convirtiendo en el evento de referencia para los profesionales del desarrollo web y móvil en Madrid. Un evento que por su concepción recuerda bastante a Iniciador y al que aún no he podido asistir por problemas de agenda pero que sin duda lo haré pronto. Miquel Camps es uno de sus principales impulsores y además es el responsable del directorio de profesionales en el que se pueden publicar ofertas de empleo y hacer recomendaciones de otros profesionales del sector.
 Hoy hay Betabeers en Madrid y es un evento abierto donde los asistentes pueden decidir la temática a tratar. En otros eventos se hacen presentaciones de proyectos o talleres sobre tecnologías específicas. El evento ya ha cumplido un año en Madrid y ya se ha comenzado a extender comenzando por Valencia donde se ha realizado un primer evento. Es muy positivo para el sector que se realicen este tipo de eventos, que los programadores se den a conocer y haya movimiento en el mercado donde hay muchas startups con necesidad de profesionales del desarrollo que estén a la última en los nuevos lenguajes de programación.
QuakeFeed - World Earthquakes Displayed on Esri Maps 1.1 (Mobile)
QuakeFeed - World Earthquakes Displayed on Esri Maps 1.1 (Mobile): Most features of any free earthquake app! Six different basemaps provided by ESRI. Past 7 days of earthquakes with magnitude > 2.5, displayed on a map or in list. Variety of filter / sort options. Location aware - find quakes that are closest to you. Beautiful UI - check out our screenshots! Twitter, Facebook, and email integration.BASIC FEATURES*World quakes > 2.5 magnitude for past...
ArcGIS Comes to the Android Platform
ArcGIS Comes to the Android Platform
ArcGIS Comes to the Android Platform
Esri Releases Free App in the Android Market
October 26, 2011

Use the ArcGIS for Android app to quickly find and edit map features.
Redlands, California—Google Android users can now access data and mapping capabilities on their smartphones with the ArcGIS for Android application. ArcGIS for Android lets users find and share maps as well as deploy GIS data and functionality on Android devices. The free app is now available and can be downloaded directly from the Android Market.
ArcGIS for Android is a native application that serves as a mobile gateway into the ArcGIS system. It provides an intuitive user experience for querying map layers and data. People can also use the app to edit features and attribute information on the fly while collecting field data and performing inspections. In addition, ArcGIS for Android includes a legend, a Favorites feature, and a tool for measuring area and distance.
ArcGIS for Android is built on Esri's ArcGIS Runtime Software Development Kit (SDK). This SDK lets developers create custom spatially enabled applications for Android devices and is designed to use web services available from ArcGIS. Apps built using the ArcGIS Runtime SDK can be deployed within the enterprise or to the public via the Android Market. The ArcGIS Runtime SDK for Android is currently in public beta, with final release expected in November 2011.
To learn more, visit esri.com/android.
# # #
Press Information:
Matthew DeMeritt, Esri
Tel.: 909-793-2853, extension 1-2930
E-mail (press only): press@esri.com
General Information: info@esri.com
Esri Acquires SpotOn, Bringing Spatial Analytics to IBM Cognos Customers
Esri Acquires SpotOn, Bringing Spatial Analytics to IBM Cognos Customers: Esri will exhibit its business intelligence software called SpotOn at the Information On Demand 2011 conference in Las Vegas, Nevada, October 23-27.
ArcGIS Now on Android
ArcGIS Now on Android: Esri has announced the availability of ArcGIS on the Android platform:
Google Android users can now access data and mapping capabilities on their smartphones with the ArcGIS for Android application. ArcGIS for Android lets users find and share maps as well as deploy GIS data and functionality on Android devices. The free app is now available and can [...]
Google Android users can now access data and mapping capabilities on their smartphones with the ArcGIS for Android application. ArcGIS for Android lets users find and share maps as well as deploy GIS data and functionality on Android devices. The free app is now available and can [...]
Mejoras en el “mapa topográfico” mundial
Mejoras en el “mapa topográfico” mundial:
Este vídeo corresponde a un vuelo virtual tridimensional sobre la isla de Oahu, en Hawái basada en datos del radiómetro ASTER a bordo del satélite Terra. Se trata simplemente de un ejemplo sobresaliente de las mejoras introducidas en el modelo digital del terreno (MDT o DEM en inglés) que pretende cubrir toda la superficie de la Tierra partiendo de datos de la NASA y del gobierno japonés. Ya he comentado anteriormente en La Cartoteca detalles sobre este proyecto, lo único que quiero resaltar hoy es que las mejoras son realmente impresionantes en lo que se refiere sobre todo a resolución. El proyecto ya cubre la mayor parte de la superficie terrestre y es de libre acceso para cualquier persona. Más información: NASA, Japan Release Improved Topographic Map of Earth.
Acceso online a los datos del proyecto: ASTER Global Digital Elevation Model (ASTER GDEM) y LP DAAC ASTER/MODIS
Nota personal: Es cuestión de gustos, pero personalmente prefiero ver el vídeo sin sonido, porque el fondo musical elegido me parece demasiado tópico. ![]()
Product Overview: GeoIQ - Making Your Maps Smarter and Better Looking Too - Directions Magazine
Product Overview: GeoIQ - Making Your Maps Smarter and Better Looking Too - Directions Magazine
 FortiusOne, Inc.
1200 Eton Ct. NW, Suite 300
Washington, DC 20007-3239
202-333-8559
866-333-8018
www.fortiusone.com
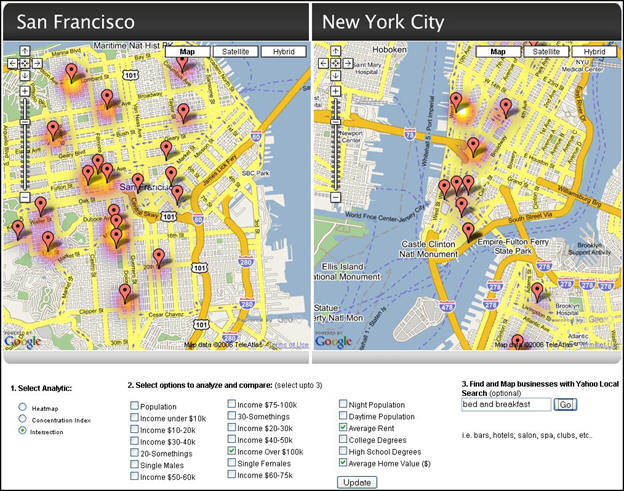
GeoIQ is an open platform that allows you to create applications integrating your data and other folks' data using Google Maps and Microsoft Visual Earth APIs. This combination provides not only interesting visualizations, it also allows for fairly complex analysis in an easy-to-use interface. GeoIQ operates as a Web service; the API lets you configure its usage, the data sources and the level of analysis.
GeoIQ's robust analytics uses map algebra, enabling very fast calculations and the capability to calculate heat maps as well as concentration and intersection indices. GeoIQ bridges the gap between Google Maps (or any other Web mapping application) and traditional GIS. All these tasks can be performed by users who are without significant GIS experience. GeoIQ's objective, as stated by FortiusOne, is to provide true spatial analysis within a Web browser.
Here's a quote from the company's website:
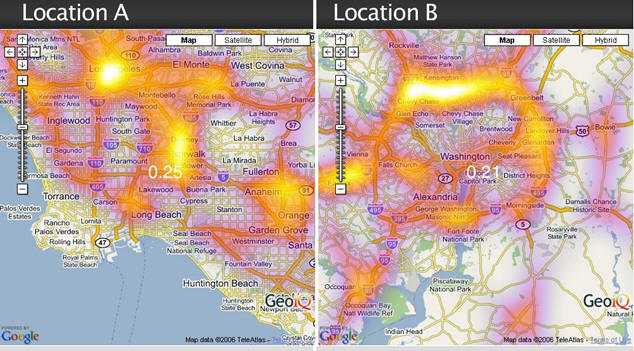
While we are accustomed to seeing transparent fills and gradients, the Heat Map combines both, yielding a very interesting visual presentation.
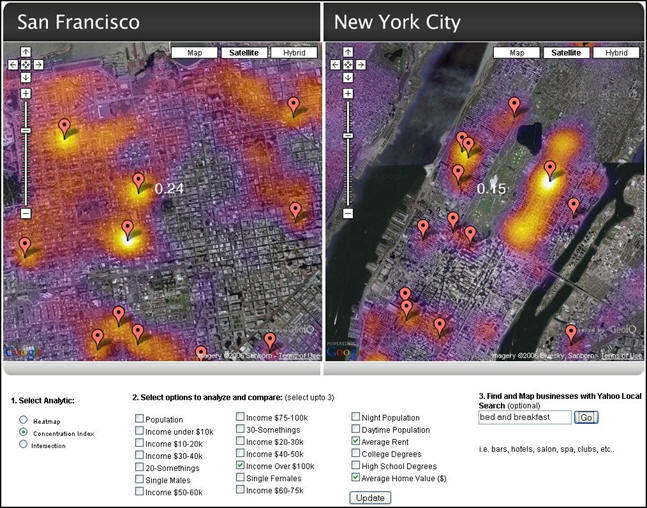
If you are looking for a new site to open a business, GeoIQ can show you the exact location at which your desired demographic and site characteristics intersect. For example, if you are looking to open a new high-end bed and breakfast, you might want to know where the existing B&B's in high property value and high-income neighborhoods are located, as shown below.
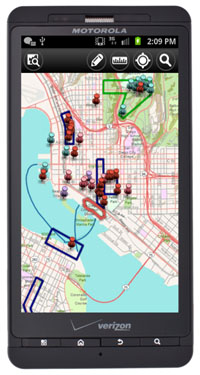
Traffic data are available via the Web, and GeoIQ can render those data in seconds. If you use your imagination, the image above could show product flow tracked by RFID readers, communication traffic or almost any other data associated with a linear feature.
Speaking of imagination, here is a GeoIQ example created by Pamela Fox. It uses the GeoIQ API and lets you create your own heat map without having to write any code. Give it a try.
Of course, to make any mapping application go, you need data. GeoIQ offers many links to data on the company's site, including the following:
Demographics
Offshore Crude Pipelines
Gas Storage Facilities
Offshore Well Production
Simulated Hurricane Path
Electric Demand
Power Plants
Railways
Crude Pipelines Affected by Hurricane
Waterways
Highways
Earthquakes
Past Hurricane Tracks
The API is still in beta and you can download it - along with a key and some free data. You can also join the discussion group and check out the company's blog.
Product Overview: GeoIQ - Making Your Maps Smarter and Better Looking Too
Tuesday, December 19th 2006
Classified Ads:
CSUN's GIST is a 12-month, graduate-certificate program that provides the advanced skills, capabilities and hands-on experience needed to increase professional relevancy in this rapidly changing field. Credits earned will soon be applicable to the CSUN MPA degree. Click here

CSUN's GIST is a 12-month, graduate-certificate program that provides the advanced skills, capabilities and hands-on experience needed to increase professional relevancy in this rapidly changing field. Credits earned will soon be applicable to the CSUN MPA degree. Click here
1200 Eton Ct. NW, Suite 300
Washington, DC 20007-3239
202-333-8559
866-333-8018
www.fortiusone.com
GeoIQ is an open platform that allows you to create applications integrating your data and other folks' data using Google Maps and Microsoft Visual Earth APIs. This combination provides not only interesting visualizations, it also allows for fairly complex analysis in an easy-to-use interface. GeoIQ operates as a Web service; the API lets you configure its usage, the data sources and the level of analysis.
GeoIQ's robust analytics uses map algebra, enabling very fast calculations and the capability to calculate heat maps as well as concentration and intersection indices. GeoIQ bridges the gap between Google Maps (or any other Web mapping application) and traditional GIS. All these tasks can be performed by users who are without significant GIS experience. GeoIQ's objective, as stated by FortiusOne, is to provide true spatial analysis within a Web browser.
Here's a quote from the company's website:
"GeoIQ empowers your organization or user community with the ability to see and analyze the world from a location perspective. With colorful, intuitive heat maps, users can finally get valuable insight from a wealth of geographic data without leaving their web browser."The most immediately striking visualization is the ‘Heat Map.' It provides not only enhanced thematics, but also the ability to thematize linear features, something not generally found in traditional mapping software.
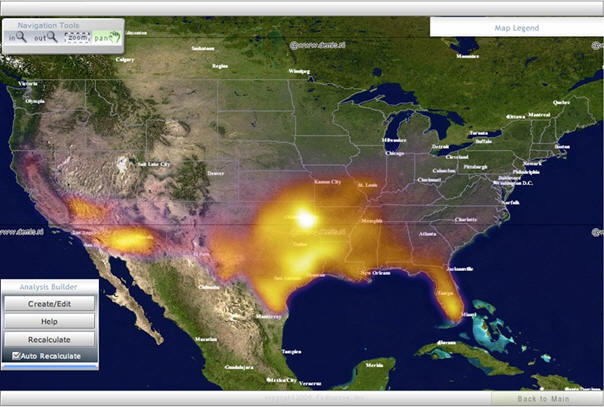 |
While we are accustomed to seeing transparent fills and gradients, the Heat Map combines both, yielding a very interesting visual presentation.
 |
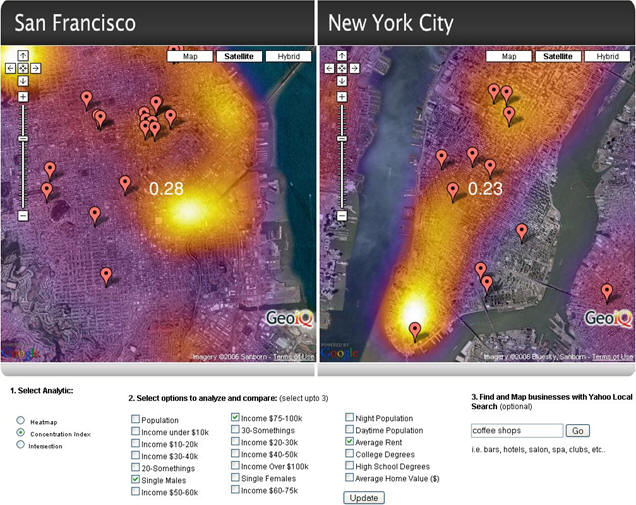 |
If you are looking for a new site to open a business, GeoIQ can show you the exact location at which your desired demographic and site characteristics intersect. For example, if you are looking to open a new high-end bed and breakfast, you might want to know where the existing B&B's in high property value and high-income neighborhoods are located, as shown below.
 |
 |
Traffic data are available via the Web, and GeoIQ can render those data in seconds. If you use your imagination, the image above could show product flow tracked by RFID readers, communication traffic or almost any other data associated with a linear feature.
Speaking of imagination, here is a GeoIQ example created by Pamela Fox. It uses the GeoIQ API and lets you create your own heat map without having to write any code. Give it a try.
Of course, to make any mapping application go, you need data. GeoIQ offers many links to data on the company's site, including the following:
Demographics
Offshore Crude Pipelines
Gas Storage Facilities
Offshore Well Production
Simulated Hurricane Path
Electric Demand
Power Plants
Railways
Crude Pipelines Affected by Hurricane
Waterways
Highways
Earthquakes
Past Hurricane Tracks
The API is still in beta and you can download it - along with a key and some free data. You can also join the discussion group and check out the company's blog.
Suscribirse a:
Entradas (Atom)
Glad you liked it. Would you like to share?
Sharing this page …
Thanks! Close
Add New Comment
Showing 0 comments