Product Overview: GeoIQ - Making Your Maps Smarter and Better Looking Too
Tuesday, December 19th 2006
Classified Ads:
CSUN's GIST is a 12-month, graduate-certificate program that provides the advanced skills, capabilities and hands-on experience needed to increase professional relevancy in this rapidly changing field. Credits earned will soon be applicable to the CSUN MPA degree. Click here

CSUN's GIST is a 12-month, graduate-certificate program that provides the advanced skills, capabilities and hands-on experience needed to increase professional relevancy in this rapidly changing field. Credits earned will soon be applicable to the CSUN MPA degree. Click here
1200 Eton Ct. NW, Suite 300
Washington, DC 20007-3239
202-333-8559
866-333-8018
www.fortiusone.com
GeoIQ is an open platform that allows you to create applications integrating your data and other folks' data using Google Maps and Microsoft Visual Earth APIs. This combination provides not only interesting visualizations, it also allows for fairly complex analysis in an easy-to-use interface. GeoIQ operates as a Web service; the API lets you configure its usage, the data sources and the level of analysis.
GeoIQ's robust analytics uses map algebra, enabling very fast calculations and the capability to calculate heat maps as well as concentration and intersection indices. GeoIQ bridges the gap between Google Maps (or any other Web mapping application) and traditional GIS. All these tasks can be performed by users who are without significant GIS experience. GeoIQ's objective, as stated by FortiusOne, is to provide true spatial analysis within a Web browser.
Here's a quote from the company's website:
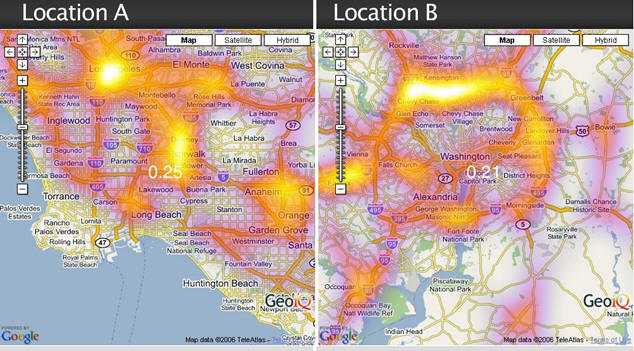
"GeoIQ empowers your organization or user community with the ability to see and analyze the world from a location perspective. With colorful, intuitive heat maps, users can finally get valuable insight from a wealth of geographic data without leaving their web browser."The most immediately striking visualization is the ‘Heat Map.' It provides not only enhanced thematics, but also the ability to thematize linear features, something not generally found in traditional mapping software.
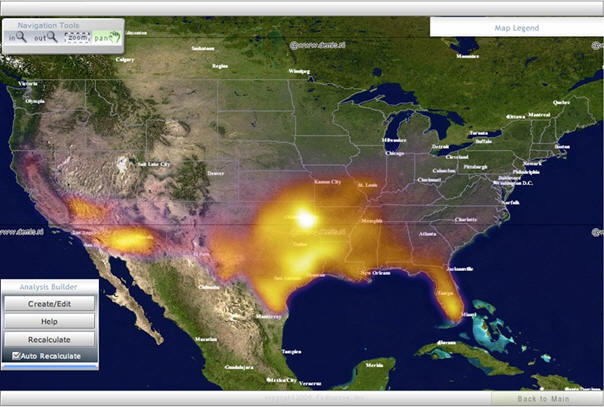 |
While we are accustomed to seeing transparent fills and gradients, the Heat Map combines both, yielding a very interesting visual presentation.
 |
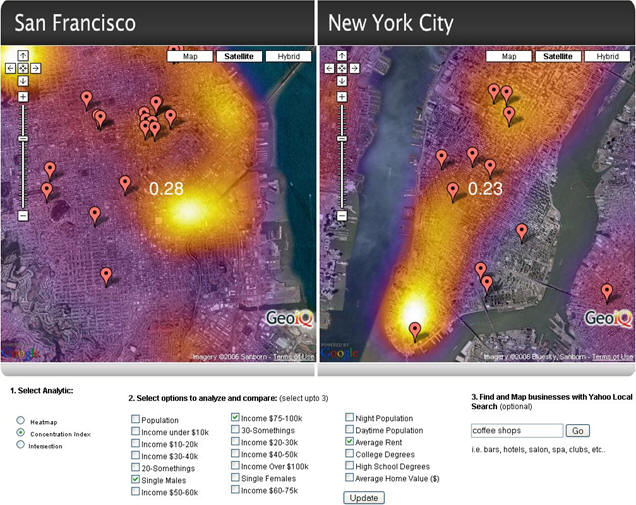 |
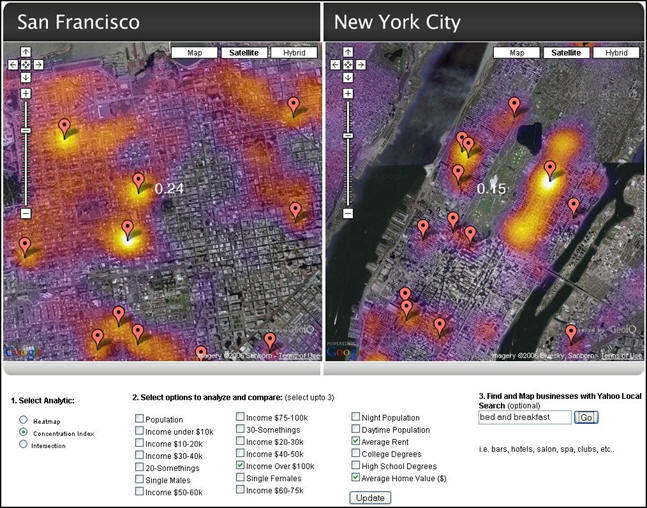
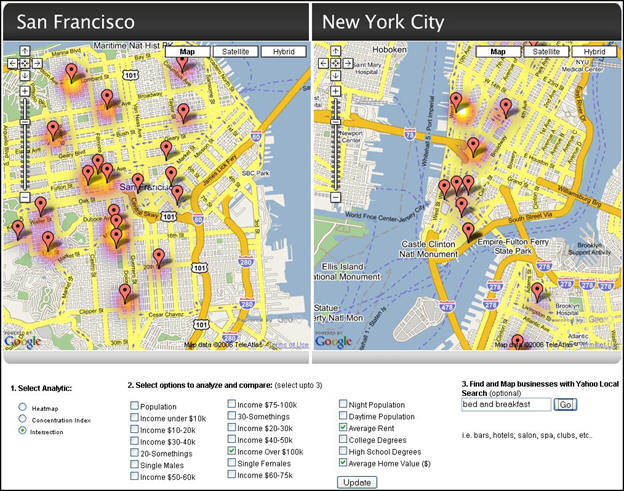
If you are looking for a new site to open a business, GeoIQ can show you the exact location at which your desired demographic and site characteristics intersect. For example, if you are looking to open a new high-end bed and breakfast, you might want to know where the existing B&B's in high property value and high-income neighborhoods are located, as shown below.
 |
 |
Traffic data are available via the Web, and GeoIQ can render those data in seconds. If you use your imagination, the image above could show product flow tracked by RFID readers, communication traffic or almost any other data associated with a linear feature.
Speaking of imagination, here is a GeoIQ example created by Pamela Fox. It uses the GeoIQ API and lets you create your own heat map without having to write any code. Give it a try.
Of course, to make any mapping application go, you need data. GeoIQ offers many links to data on the company's site, including the following:
Demographics
Offshore Crude Pipelines
Gas Storage Facilities
Offshore Well Production
Simulated Hurricane Path
Electric Demand
Power Plants
Railways
Crude Pipelines Affected by Hurricane
Waterways
Highways
Earthquakes
Past Hurricane Tracks
The API is still in beta and you can download it - along with a key and some free data. You can also join the discussion group and check out the company's blog.
No hay comentarios:
Publicar un comentario